
Thanks to
transnational collaboration and the pooling of multiple databases, the HoliCow
project gathered a very large number of data and prediction
models [1] acquired and developed during previous projects (see diagram below). The aim, therefore, is not to create yet more
new models but to combine information in order to offer farmers a holistic view
of the condition of their cows. With all these resources, several stages were
necessary in order to work optimally for the development of the final tool.
(see diagram below). The aim, therefore, is not to create yet more
new models but to combine information in order to offer farmers a holistic view
of the condition of their cows. With all these resources, several stages were
necessary in order to work optimally for the development of the final tool.
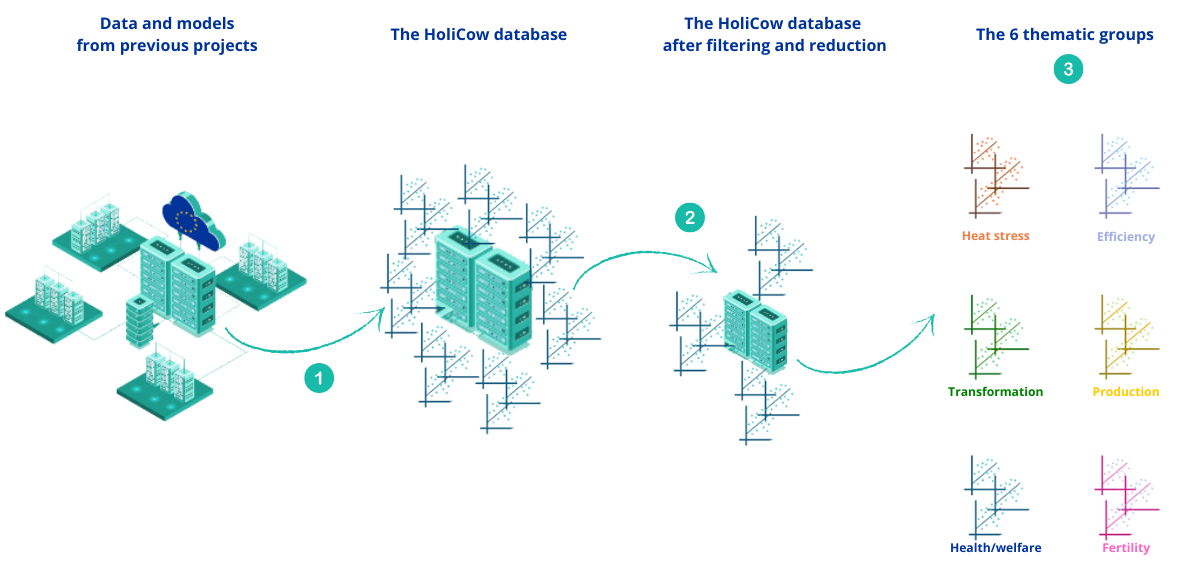
Step 1: Selection
Firstly, the
scientists selected  the most
relevant models for the project. Indeed, in the pooling and inventory carried
out at the start of the project, redundancies were observed or several versions
of the same model [2] were in the database.
the most
relevant models for the project. Indeed, in the pooling and inventory carried
out at the start of the project, redundancies were observed or several versions
of the same model [2] were in the database.
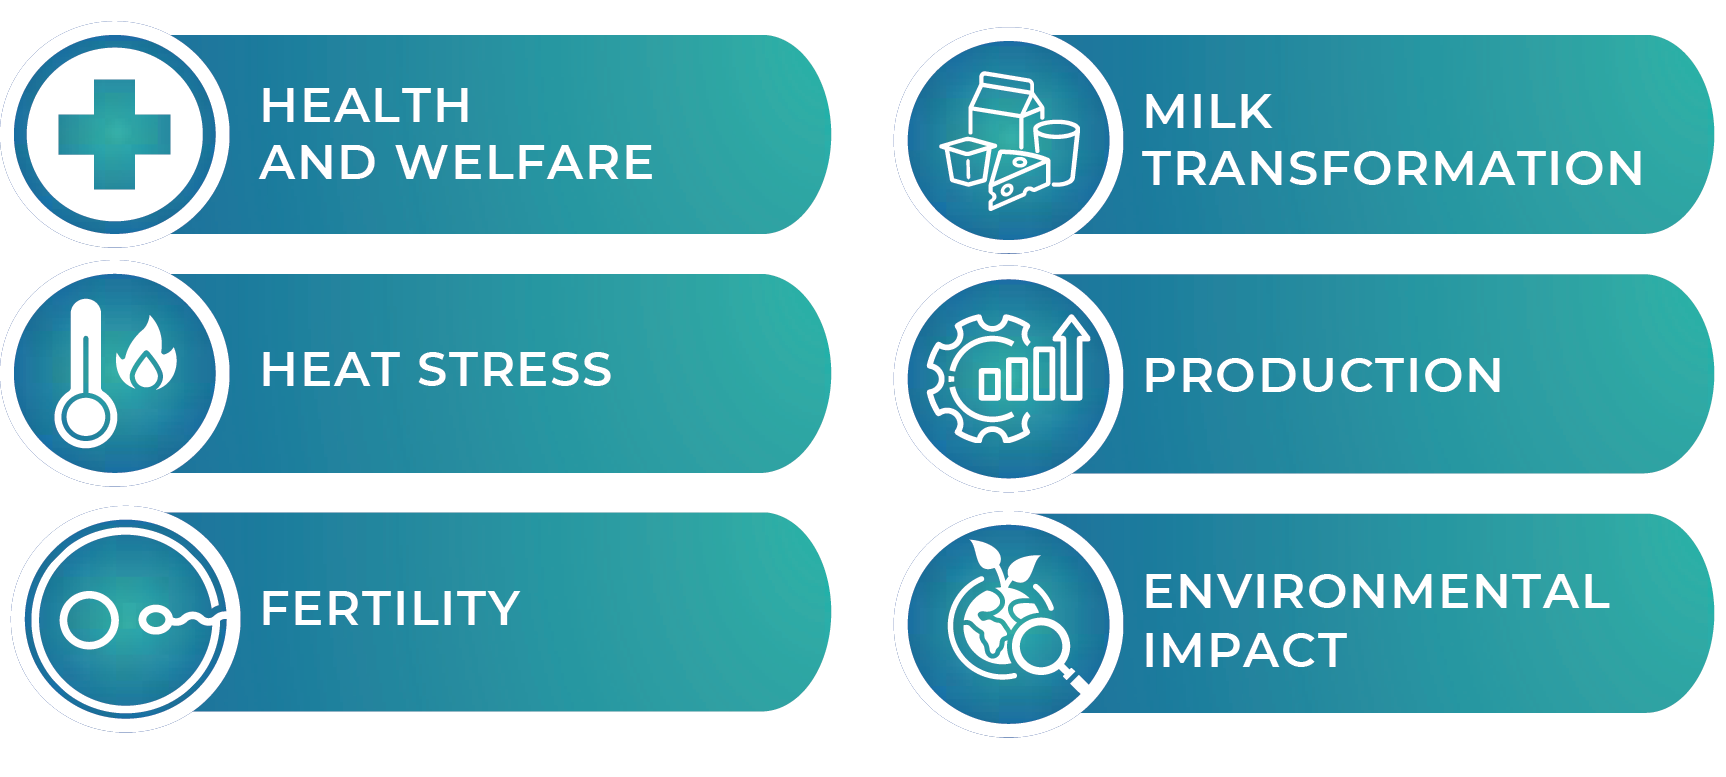
Step 2: Grouping
Each model provides its own information, which
can be linked to a specific theme. Six working groups corresponding to these
themes were therefore created to obtain a more accurate holistic view :
:

Step 3: The clusters
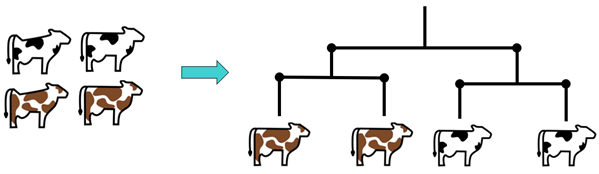
Great! But for each theme, we still had to find a way of working with all this data. That's where clustering comes in! Don't panic, behind this word, which may seem complicated, is simply a data analysis technique that brings together individuals with similar data. These individuals then form a group according to a certain data profile. Analysts generally refer to these groups as “clusters”.
To understand this better, let's take a simple example: below we look at the “colour” thematic group, which contains the “black colour” and “brown colour” clusters. We can therefore classify our cows in one cluster or the other according to the colour of their coat. However, this labelling only allows the animal to belong strictly to one or the other group (that’s what we call discrete distribution).
In the project, however, it made more sense to work with continuous distribution. If we take the ‘health/welfare’ theme group as an example, a cow starts by showing symptoms and develops an illness little by little. Or conversely, during her convalescence, she gets better and better. So it's a process that evolves over time. That's why we decided to work on the probabilities of belonging to one or another cluster. If we take the example of the “colour” group, we now have this information: ‘I have an x% probability of belonging to the “black colour” cluster’, or, in the example of the sick cow, ‘I have an x% probability of belonging to the “sick cow” cluster’. This percentage probability will therefore vary according to the stage of the disease.
Step 4: Towards the tool
These probabilities
can now be communicated to farmers to support them in managing their herds. But
how? Our aim is for these probability results to give information both at
herd-level and at inter-herd-level. This will enable a farmer to compare his
herd to others. Indeed, a high or low percentage of animals for a certain
cluster within a given herd will have the effect of making this herd deviate
from the others.
Conclusion
Each thematic group is therefore defined by several clusters. At this stage of the project, 4 thematic groups have completed the “clustering” part and will now enter the validation stage on pilot farms. It is important and essential to go through this validation stage in order to compare the researchers' developments with the reality of the field. A very concrete example would be to check whether a cow was really ill when the results predicted that she was likely to be. With this validation stage, we are therefore answering the question:
- ‘Are all the clusters in a thematic group relevant in the farms?’
- ‘Do the probabilities of an animal belonging to a cluster reflect reality?’
By answering these questions, we will then be able, in the future, to provide farmers with relevant alerts when a cow encounters problems, or, on the contrary, when a cow is performing well because it is likely to produce more or to produce milk that is highly suitable for processing, etc.
We'll keep you posted!
[1] Prediction models are calculations that use milk samples to estimate the cow's status in terms of multiple aspects (e.g. estimation of minerals, fatty acids, ketones, methane emissions, etc.).
[2] A model can evolve over time, for example to become more robust through the acquisition of new data.